Crafting Visual Stories
that Inform & Inspire
I'm Andreas Patinas, a graphic designer specializing in creating compelling brand identities and data-driven infographics that captivate and communicate with clarity.
Featured Project
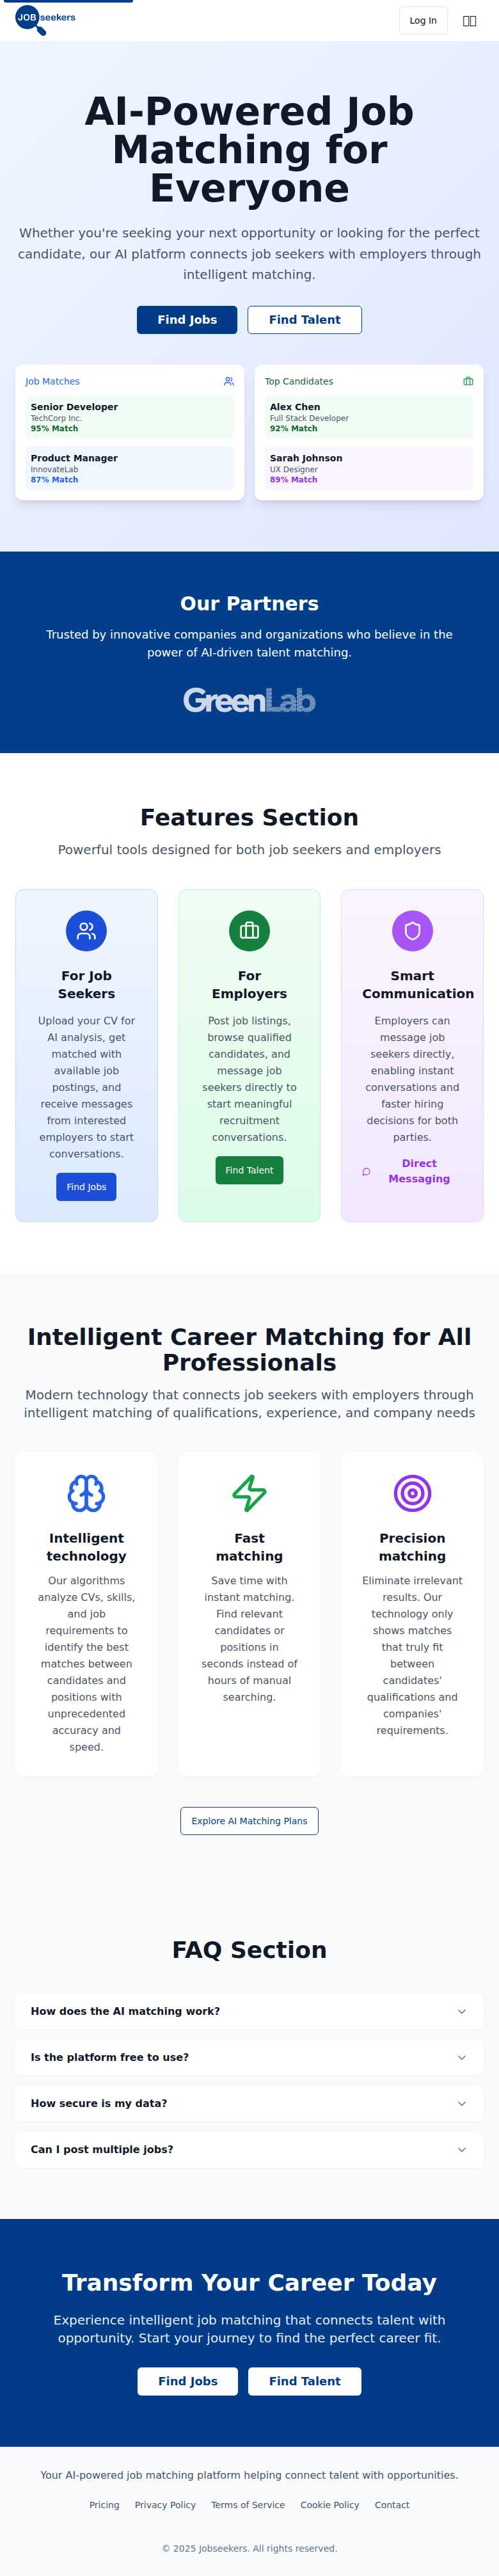
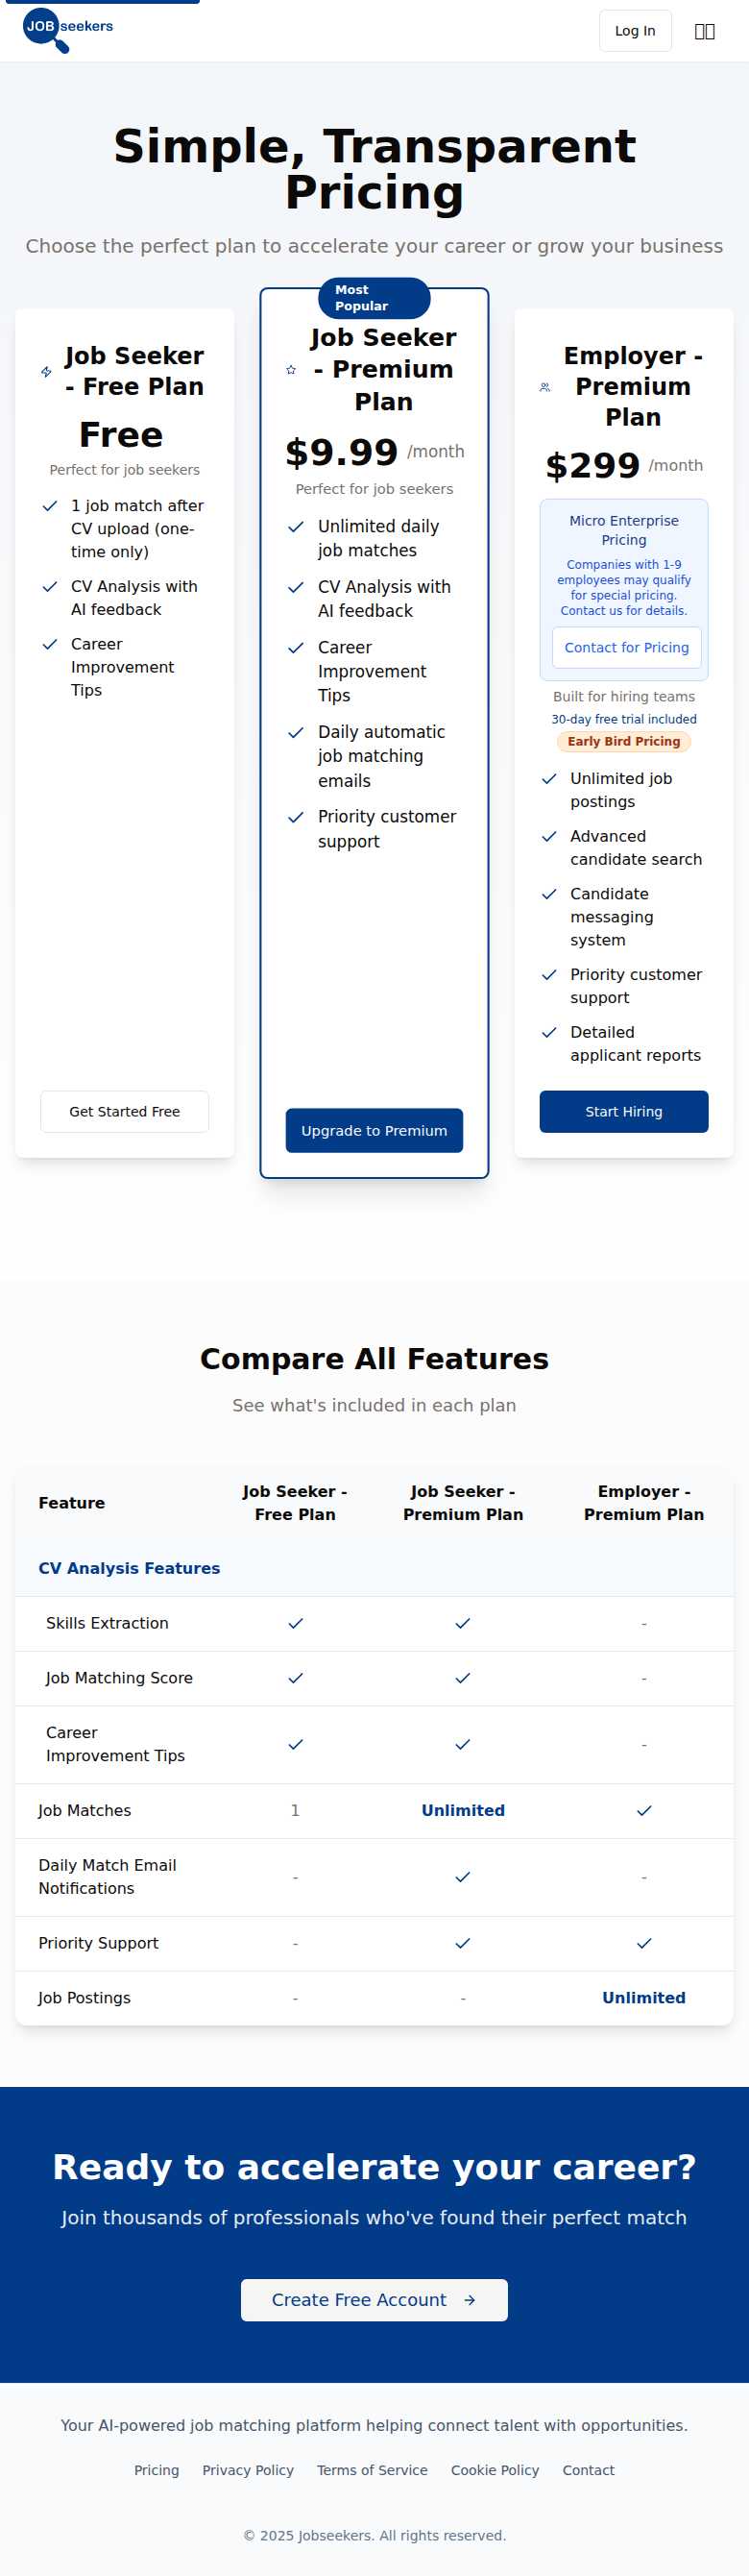
Jobseekers.dk - AI-Powered Job Matching Platform
Jobseekers is an intelligent recruitment platform that connects job seekers with employers through AI-driven matching technology. The platform analyzes CVs, extracts skills, and uses OpenAI's GPT-3.5 to provide semantic matching between candidates and job opportunities.
Key Features:
- Upload CVs for AI analysis and skill extraction
- Get matched with relevant job postings
- Receive career improvement tips
- Direct messaging with employers
- Free tier with one match, premium at $9.99/month
- Post unlimited job listings
- AI-powered candidate search
- Direct messaging system
- Detailed applicant reports
- Premium plan at $299/month
Core Technology:
- Two-stage matching: algorithmic + AI semantic analysis
- Multi-language support (English, Danish, etc.)
- Real-time notifications and messaging
- GDPR-compliant with secure data handling
Automation Showcase
Automated LinkedIn Content Publisher
This automation creates and publishes content for a LinkedIn company page. It's designed to be a "set it and forget it" system for social media management.
How It Works:
This workflow, built in n8n, automates the entire content creation and posting process:
- Gets Topics: Every three days, the workflow automatically pulls a new post topic from a list in a Google Sheet.
- Generates Content: It uses AI to write a post in Danish based on the selected topic.
- Creates Visuals: Another AI model then generates a custom infographic to go with the text.
- Posts to LinkedIn: The final text and infographic are automatically published to a specific LinkedIn organization page.
- Updates Status: Finally, it updates the Google Sheet to mark the topic as "posted," so it won't be used again.
graph TD
    A["Start: Every 3 Days"] --> B["Get Topic from Google Sheet"];
    B --> C["Generate Post Text with AI"];
    C --> D["Generate Infographic with AI"];
    D --> E["Post Content to LinkedIn"];
    E --> F["Update Google Sheet: Mark as 'Posted'"];
    F --> G["End"];

    classDef startEnd fill:#dbeafe,stroke:#3b82f6,stroke-width:2px;
    classDef process fill:#e0f2fe,stroke:#0ea5e9,stroke-width:2px;

    class A,G startEnd;
    class B,C,D,E,F process;
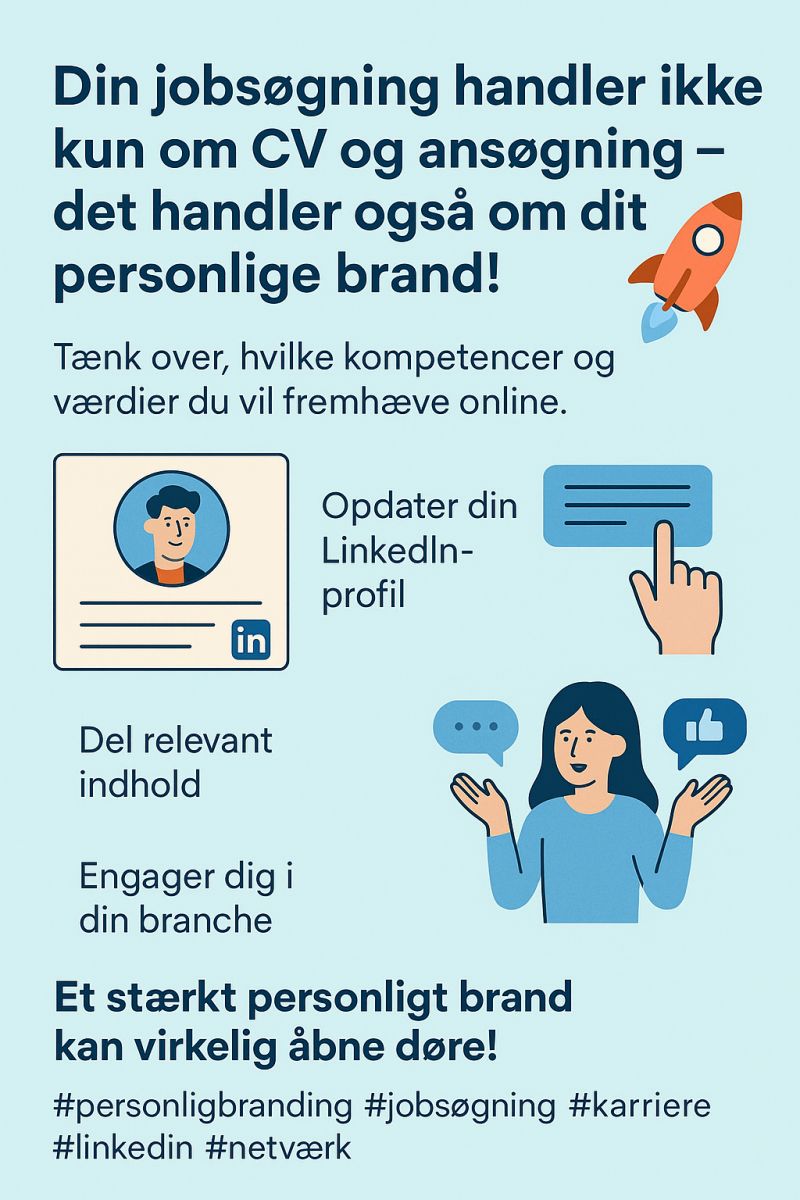
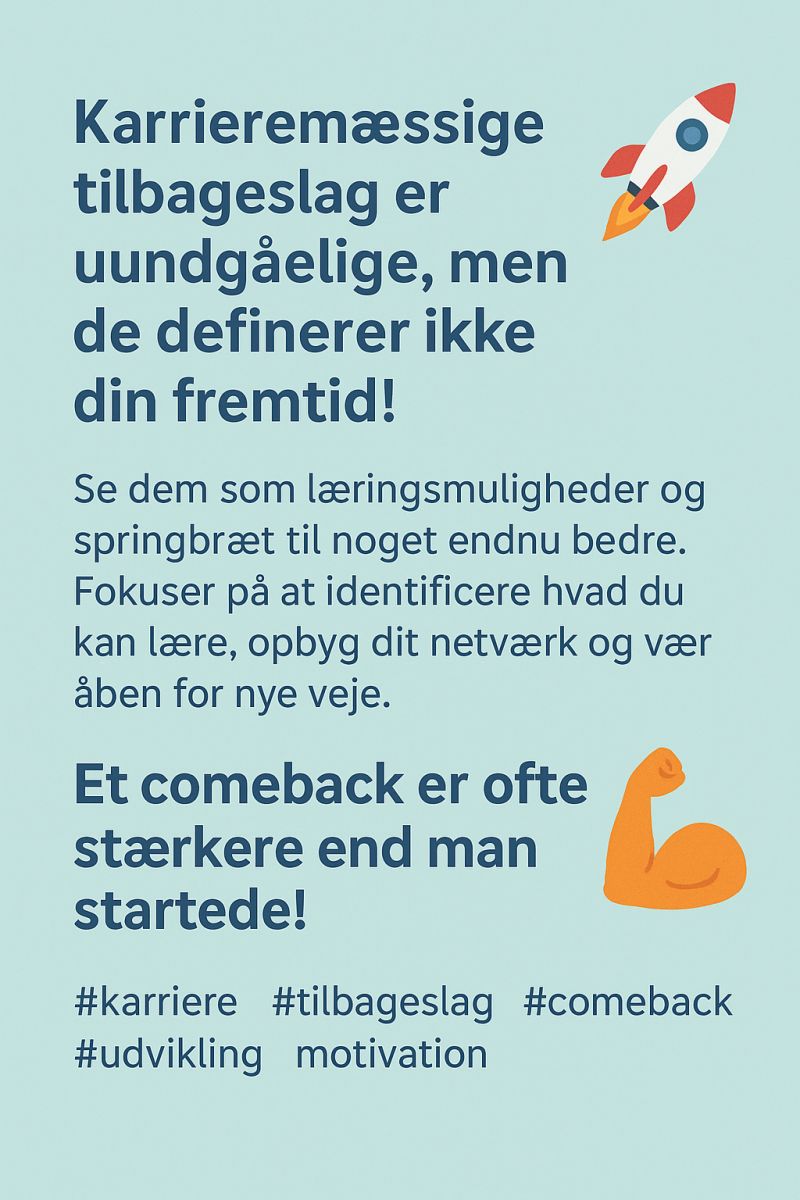
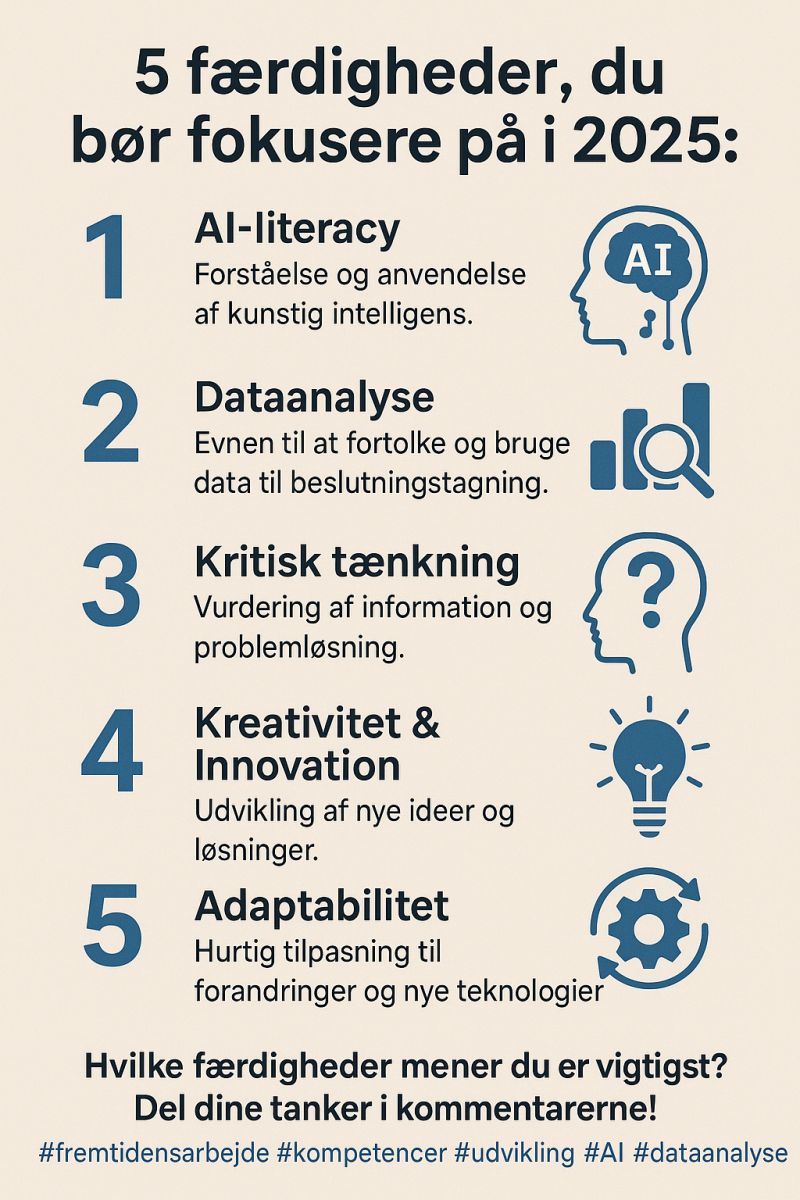
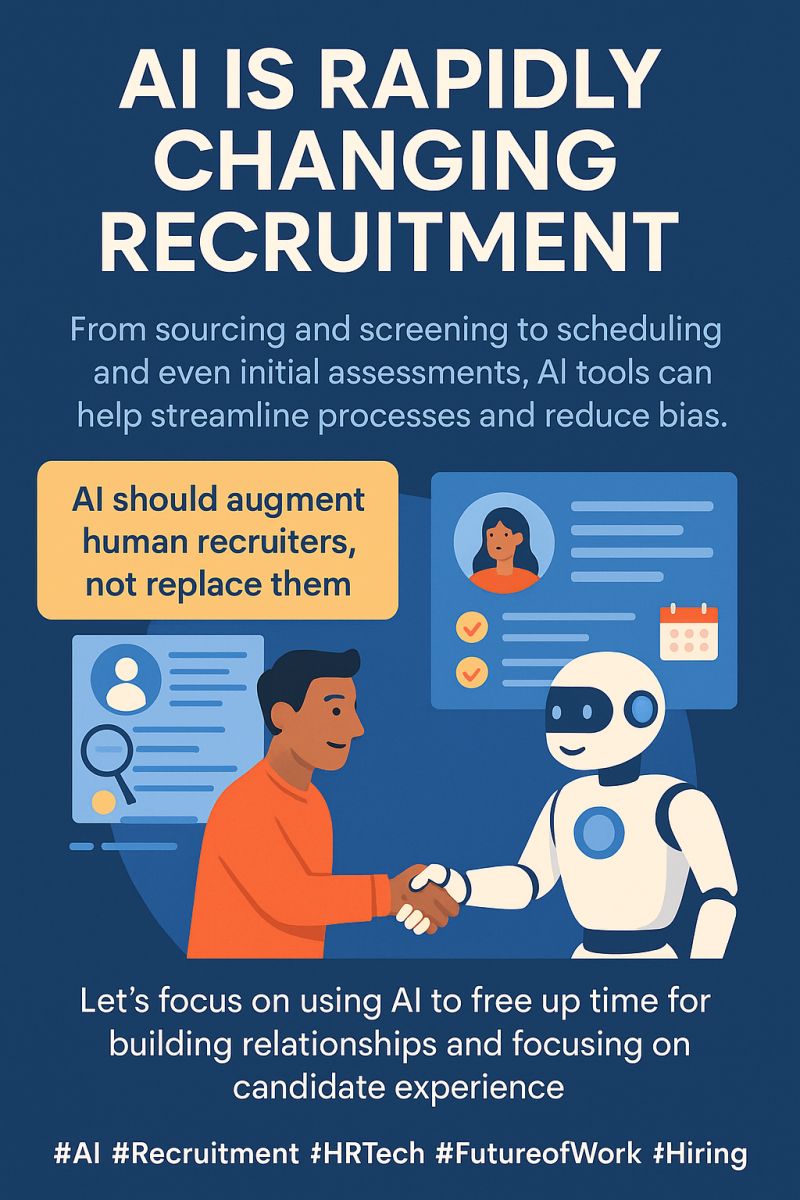
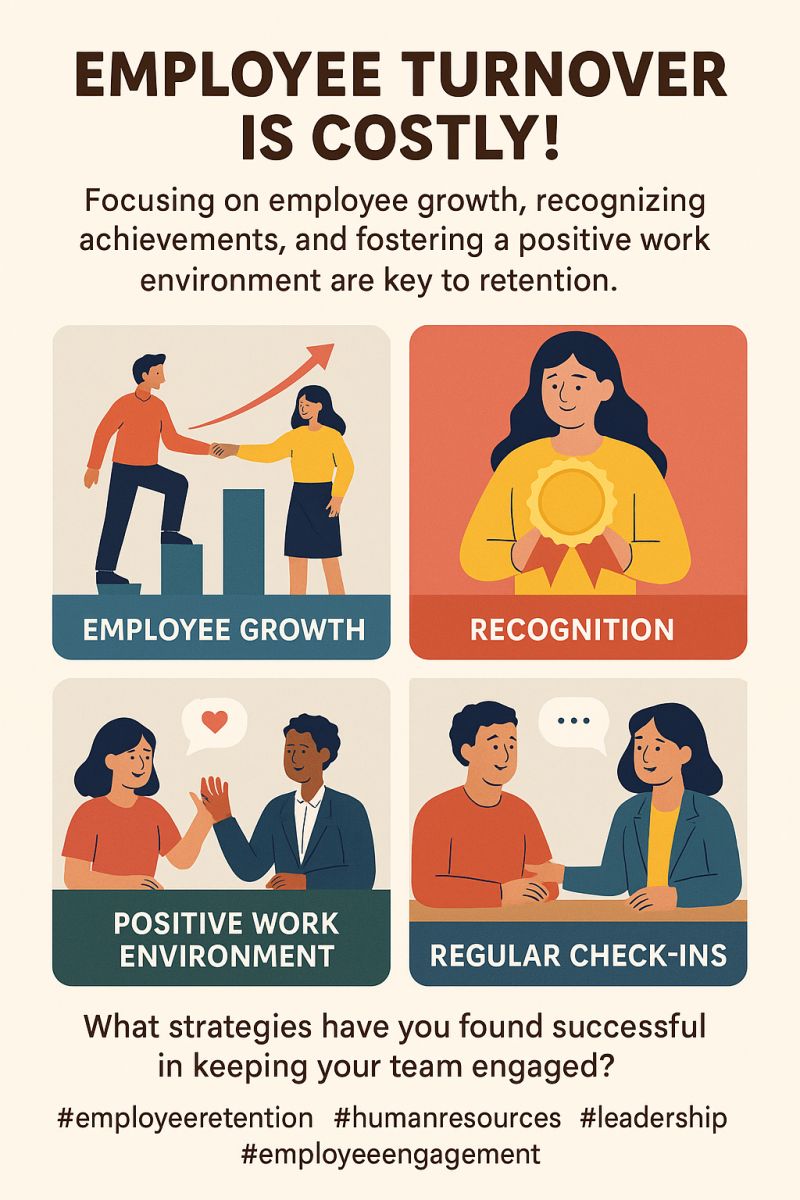
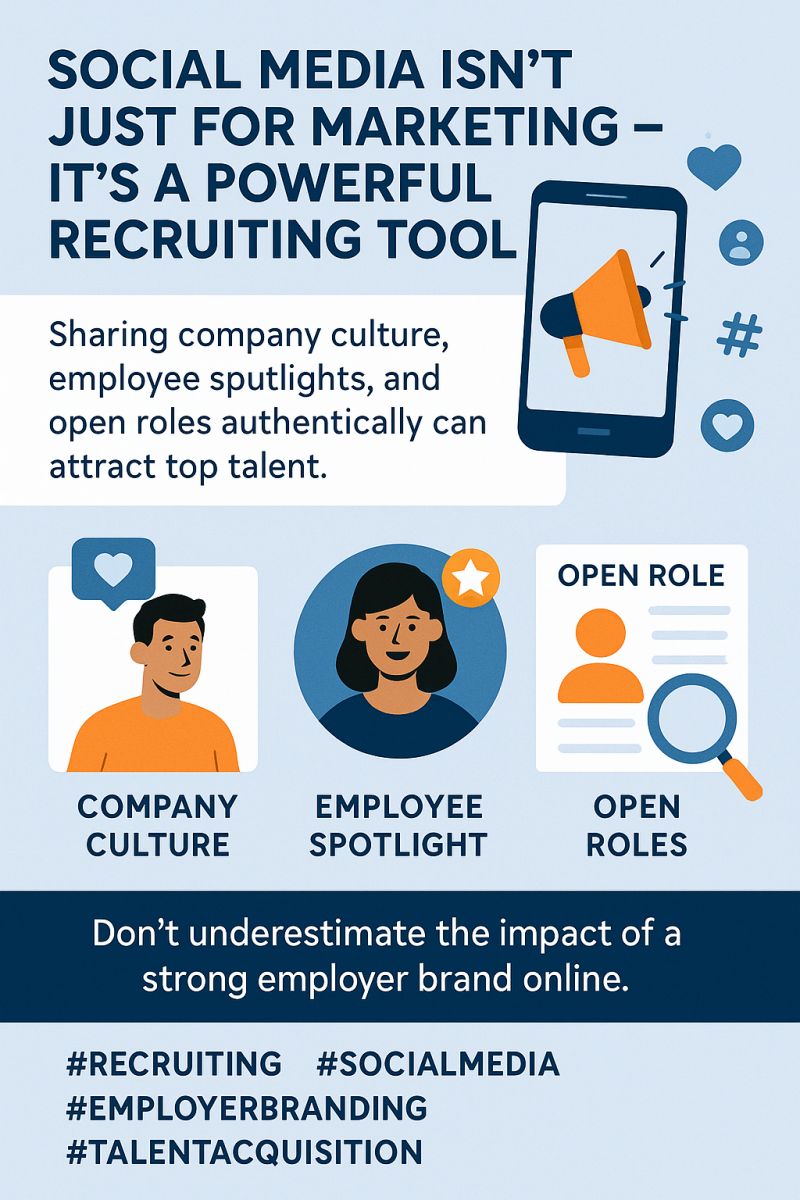
Data Visualization & Infographics
Transforming complex data into beautiful and understandable visual narratives.


Let's Create Something Amazing
Have a project in mind? I'd love to hear from you.
Thank you!
Your message has been sent successfully.
Sorry, there was an error sending your message. Please try again later.